2013年4月20日四川雅安芦山6.7级地震
震源破裂过程反演初步结果
Preliminary result for Rupture Process of Apr. 20, 2013, Mw6.7 Earthquake, Lushan, Yaan, China
王卫民1 郝金来2 姚振兴2
1中国科学院青藏高原研究所,北京,100085
2中国科学院地质与地球物理研究所,北京,100029
地震发生后,从IRIS数据中心下载了地震数据资料用于研究地震震源机制和震源破裂过程。选取其中信噪比较高并且沿方位角分布比较均匀的31个远场P波波形(震中距位于 范围之内)数据进行点源模型的震源机制解反演;根据反演结果再利用31个远场P波波形并增加14个SH波波形资料用于震源过程反演。初始破裂点取USGS给出的震中位置。
计算得到的地震矩为1.54×10**19Nm,Mw=6.7。最大滑动159cm。
结果表明:雅安芦山地震为震级Mw6.7,震源深度10.2km的逆冲断层,破裂在断层面上的分布比较集中,震中区的地震烈度(中国地震烈度表,2008)约为9度。主震和余震分布于龙门山断层带西南端的彭县—灌县断裂带上,位于2008年5月12日汶川地震后的库伦应力增加区域内(单斌等,中国科学D,2009年39卷5期),且两者震源性质相近均为逆冲断裂为主,表明该地震与汶川地震有密切关系,可视为汶川地震的强余震。
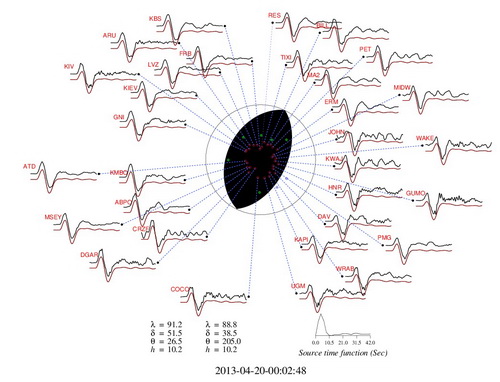
图 1 雅安芦山Mw6.7级地震震源机制解
采用下半球投影,同时给出了点源模型的P波垂向位移理论图(红线)与资料(黑线)的拟合情况。图形下方给出了两组节面解(左下,λ,δ,θ,h分别表示错动倾伏角、断层倾角、断层走向、震源深度)和点源模型的震源时间函数(右下)。
Figure 1 Focal mechanism of the Mw6.7 earthquake, Lushan, Yaan, China.
Lower-hemisphere projection is used here. The observed P wave records (black line) and the synthetic seismogram (red line) based on the simple point model are compared. The parameters of two possible fault planes are listed also, with l, d, q ,h indicating the rake angle, dip angle, strike direction and source depth respectively. The obtained source time function are plotted.
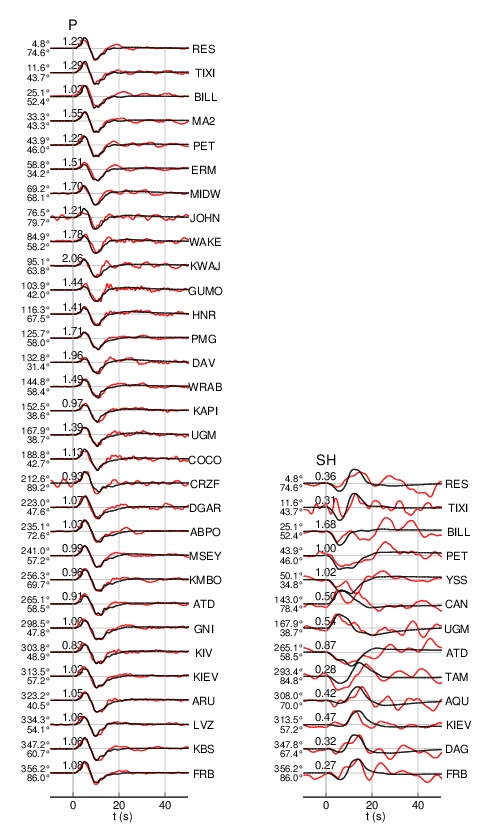
图2 有限断层模型的远场P和SH波形拟合
左列为P波垂向位移理论图(红线)与记录(黑线)的对比;右列为SH波切向位移理论图(红线)与记录(黑线)的对比;并给出每个记录的方位角(左上)、震中距(左下)、振幅比(上)和台站名(右)。
Figure 2 Comparison of the observed teleseismic P and SH records with the synthetic waveforms.
Comparison of observed (black) and synthetic waveforms (red) for P vertical components, and SH components are shown in the panel, the azimuth, epicentral distance, amplitude ratio and station name are also indicated.
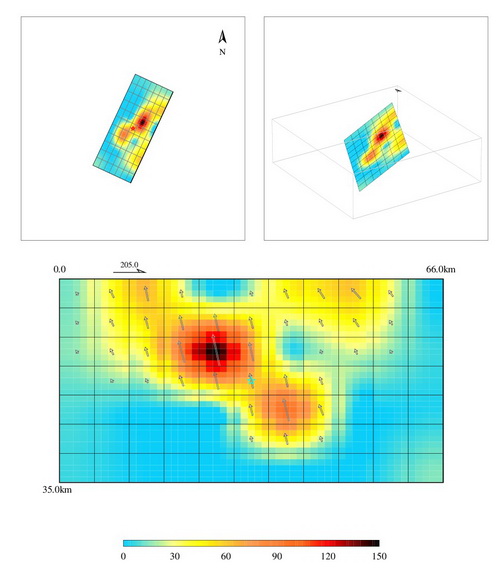
图 3 地震断层面上滑动分布
图中分别给出了有限断层模型的地表投影(左上)和三维示意图(右上)
Figure 3 Inverted slip distribution on the fault.
Surface projection of fault model ( up-left ) and 3D view of the fault model ( up-right ) are shown
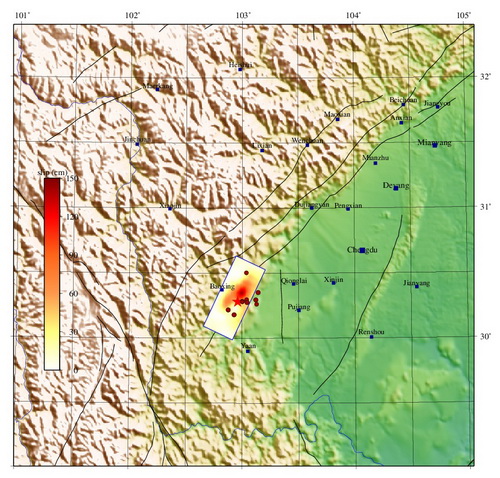
图 4 地震断层滑动分布投影
图中深红色圆点表示主震后3小时的余震分布(USGS)
Fig. 4 The map shows the projection of slip distribution on the ground
The dark red dots indicate aftershocks from USGS after mainshock 3 hours.
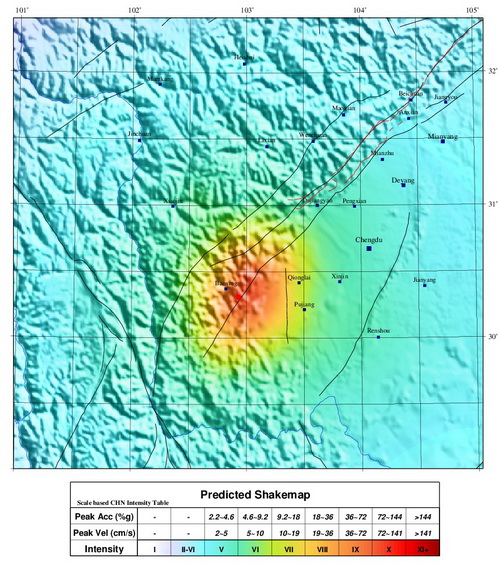
图 5 根据破裂过程模型计算的理论烈度分布
Fig. 5 Predicted Shakemap calculated from slip model
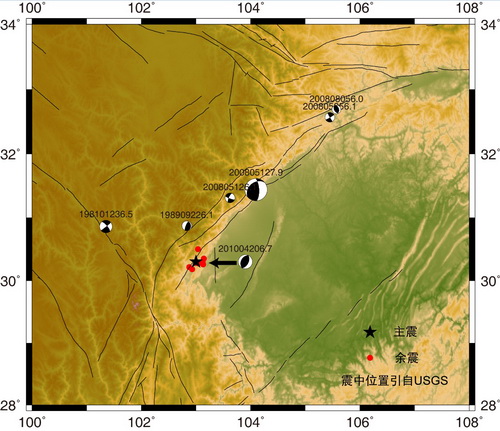
图6 历史地震震源机制
Fig. 6 Focal mechanism for history Earthquake